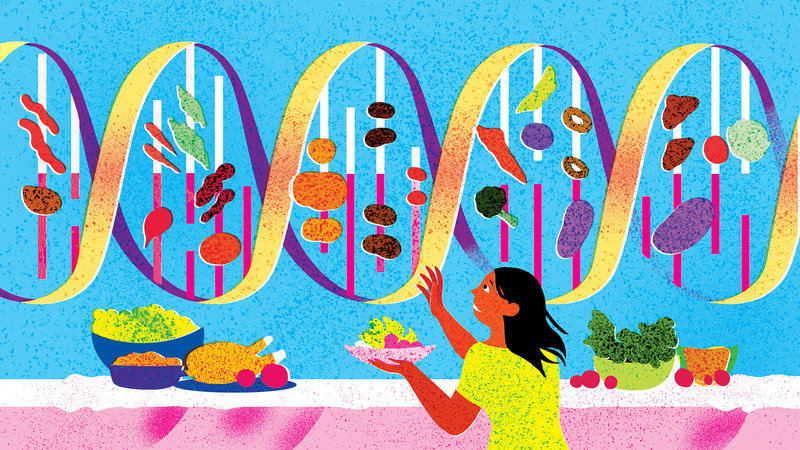
This 2015 study, published in the prestigious journal Cell, set out to investigate whether different people have different metabolic responses to the same foods and, if so, how that information could be used to develop personalized nutrition plans. Specifically, the scientists decided to measure differences in “post-prandial glycaemic responses” (PPGRs) as a primary outcome variable. In simple terms, they looked at how much blood sugar increases after a meal as a marker of metabolically healthy responses. Smaller blood sugar increases (smaller PPGRs) imply healthier responses.
In the first phase of their experiment, the scientists took 800 individuals and hooked them up to continuous glucose monitors that measured their blood glucose every 5 minutes for 1 week, ultimately amounting to 1.5 million blood glucose measurements stretched over a span of 46,898 meals and 10,000,000 Calories! If that weren’t enough, every participant also logged their daily activities, such as sleep and exercise, on a smartphone app designed especially for the study, and many participants also underwent genetic analyses of their own human DNA and gut microbiomes.
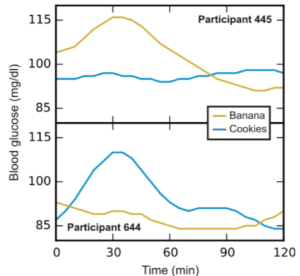
The scientists found huge PPGR variations amongst people in response to the same foods and meals. For example, participant 445 exhibited a reliably large PPGR in response to bananas, but almost no PPGR in response to cookies. By contrast, participant 644 exhibited a reliably large PPGR in response to cookies, but a small PPGR in response to banana. As counterintuitive as it may seem, this implies that, while participant 644 should opt for the fruit, participant 445 might actually be better off going for the cookie! (See figure.)
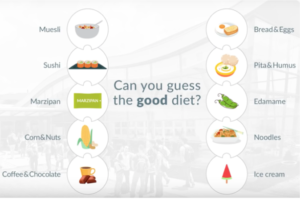
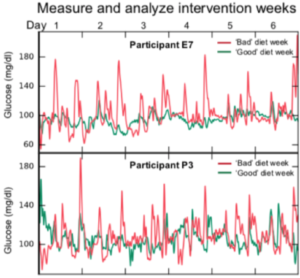
But the study didn’t stop there. The scientists now wanted to see if they could translate their findings into a useful tool, one that could design personalized diets. Therefore, they took their mountain of data and compressed it into a fancy algorithm. To test their new toy, the scientists found 26 new individuals and took a series of baseline measurements, such as their human DNA and microbiome profiles. They then fed those baseline measurements into their algorithm, which designed personalized “good” and “bad” diets for each individual. Importantly, these “good” and “bad diets” were not intuitive. To reinforce that point, see the second figure and try to guess for yourself which was the “good” diet and which was the “bad” diet (the answer is in the post-script)? Each person was then asked to wear a continuous glucose monitor and adhere to their “good” and “bad” diets on separate weeks, though they didn’t know which week was the “good” week and which was the “bad” week. The results were impressive! Almost all the participants had far better, more stable, PPGRs on the good weeks! The tool worked! (See second figure.)
In short, these data suggested that there is no “best diet for humans,” only “best diets for individual humans.” We are simply all too different!
P.S. The diet on the right, the one with the ice cream, was the “good” diet for this individual.
TED talk by the senior author: https://www.youtube.com/watch?v=0z03xkwFbw4
Paper: Zeevi D., … Segal, E. Personalized Nutrition by Prediction of Glyemic Responses. Cell 2015. https://www.cell.com/action/showPdf?pii=S0092-8674%2815%2901481-6
*The views and opinions expressed herein are those of the author and do not necessarily reflect the views of MDLingo.com, its affiliates, or its employees.